Published on May 29, 2017
Developers can learn more about the Google Maps API at
Presenter: Brendan Kenny
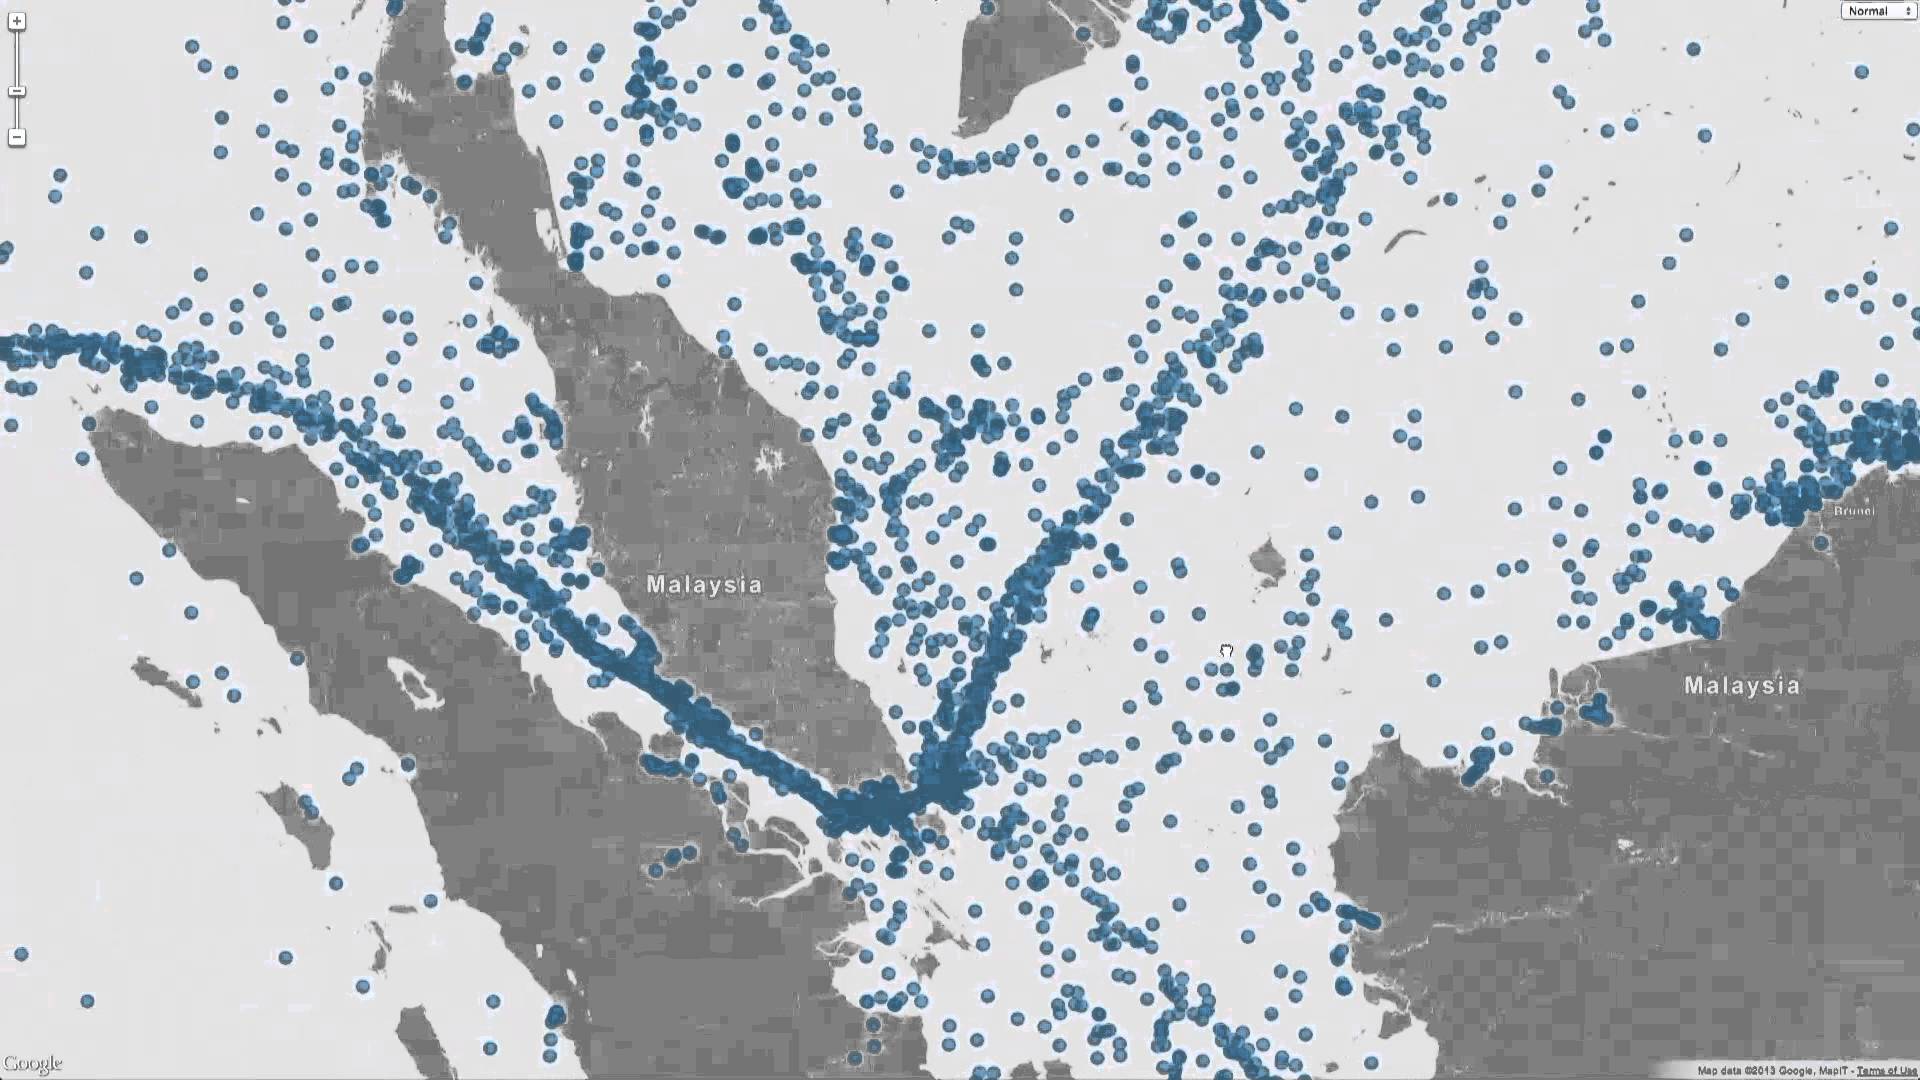
Much if not most of the worldâs data has a geographic component. Data visualizations with a geographic component are some of the most popular on the web. This session will explore the principles of data visualization and how you can use HTML5 – particularly WebGL – to supplement Google Maps visualizations.
For all I/O 2013 sessions, go to
