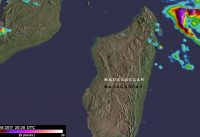
This animation of half-hourly intervals over March 3 to 8, 2017 shows Enawo dropped the highest rainfall totals of over 500 mm (almost 20 inches) in the open waters of …
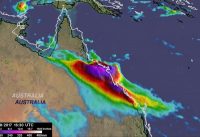
This flyby of NASA’s IMERG shows estimated rainfall accumulation generated by extra-tropical cyclones Debbie and Cook from April 5 to 14, 2017 over eastern Australia and New Zealand. IMERG data …
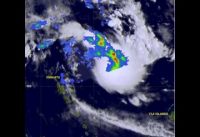
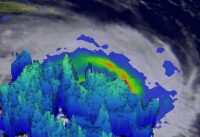
The GPM satellite measured rainfall rates in Tropical Cyclone Maarutha on April 15, 2017 at 1431 UTC (10:31 a.m. EDT) when it was approaching landfall in Burma. Rain was falling …
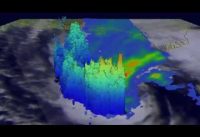
On May 7, GPM showed that some storm top heights were above 14.3 km (8.9 mile) in tall storms in the eastern eye wall where precipitation was falling at a …
Over the past week extreme rainfall has drenched northeastern Australia. This is the heaviest rainfall in that area since tropical cyclone Debbie hit Queensland Australia in late March. Much of …
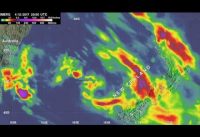
The GPM core observatory satellite passed over the Bay of Bengal on May 23, 2017 at 0251 UTC (May 22 at 10:51 p.m. EDT). GPM measured rain falling at a …
NASA’s IMERG looked at rainfall from May 23 to early May 26, 2017 and estimated over 434 mm (17 inches) or rain had fallen. Credit: NASA/JAXA, Hal Pierce
This visualization of data from NASA/JAXA’s GPM satellite shows rainfall over Texas as Tropical Storm Bill further drenched the state with rain on June 17, 2015 at 6:11 UTC (2:11 …
The accumulated precipitation product visualized here begins on Jan. 1, 2015, and runs through July 16, 2015. This visualization shows the heavy rainfall throughout Northern Texas and across Oklahoma as …