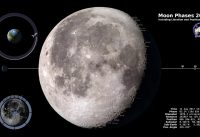
This 4K visualization shows the Moon’s phase and libration at hourly intervals throughout 2018, as viewed from the Northern Hemisphere. Two ‘supermoons’ will ring in the New Year on Jan. …
This video is a part of: Southern Hemisphere Harvesting Systems – 2011 Update From: Tigercat Website: YouTube Channel: ————————————————————————————————————- Video available at: Site:
This visualization shows a flat map of the Earth with summertime temperature anomalies for the Northern Hemisphere. This analysis compares observed seasonal mean temperatures (June-July-August) to the seasonal mean temperatures …
This bell curve graph shows how the distribution of Northern Hemisphere summer temperature anomalies has shifted toward an increase in hot summers. The seasonal mean temperature for the entire base …
This video is a part of: Southern Hemisphere Harvesting Systems – 2011 Update From: Tigercat Website: YouTube Channel: ————————————————————————————————————- Video available at: Site:
This video is a part of: Southern Hemisphere Harvesting Systems – 2011 Update From: Tigercat Website: YouTube Channel: ————————————————————————————————————- Video available at: Site:
This video is a part of: Southern Hemisphere Harvesting Systems – 2011 Update From: Tigercat Website: YouTube Channel: ————————————————————————————————————- Video available at: Site:
This video is a part of: Southern Hemisphere Harvesting Systems – 2011 Update From: Tigercat Website: YouTube Channel: ————————————————————————————————————- Video available at: Site:
This 4K visualization shows the Moon’s phase and libration at hourly intervals throughout 2017, as viewed from the northern hemisphere. Each frame represents one hour. In addition, this visualization shows …
SYNCHRONIZE WITH DEREK’S VIDEO: Both videos on one page (for desktop): Subscribe to Veritasium: TWEET THIS! ↓↓↓↓↓↓↓More info Below ↓↓↓↓↓↓↓ Some notes about this. We each repeated the experiment 3 …