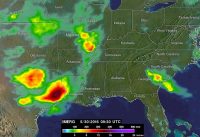
Cindy’s total rainfall from June 20 through early June 23, 2017 was estimated using precipitation estimates from NASA’s IMERG. Totals exceeding 10.5 inches (266.7 mm) occurred in eastern Texas, southern …
This animation of IMERG data for Harvey were compiled for the period from August 23 to 29, 2017 as it moved through the Gulf of Mexico and stalled over Texas. …
An estimate of rainfall totals from May 27, 2016 to June 2, 2016 was made using data from NASA’s Integrated Multi-satellitE Retrievals for GPM (IMERG). During this period rainfall totals …
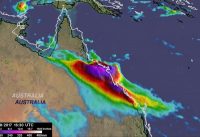
Over the past week extreme rainfall has drenched northeastern Australia. This is the heaviest rainfall in that area since tropical cyclone Debbie hit Queensland Australia in late March. Much of …
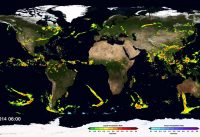
NASA’s Global Precipitation Measurement mission has produced its first global map of rainfall and snowfall. The GPM Core Observatory launched one year ago on Feb. 27, 2014 as a collaboration …
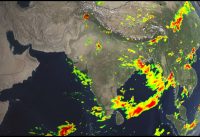
Animation of precipitation rates across India and surrounding countries. Notice the heavy rains throughout the Ghats Mountain range which resulted in devastating landslides along India’s west coast. The ten satellites …
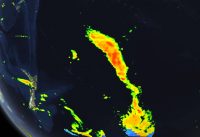
Animation of Precipitation Rates in the South Pacific. Notice the consistent frontal bands as they travel eastward across the southern Pacific Ocean. The ten satellites in the Global Precipitation Measurement …
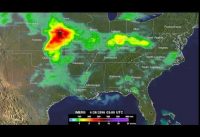
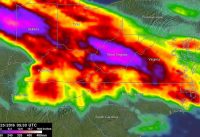
The IMERG analysis from June 20 through 26, 2016 showed that extreme rainfall occasionally occurred from Illinois through North Carolina. Large areas of from Illinois, Indiana and West Virginia were …