The GPM core observatory satellite had a good view of tropical cyclone 04B’s remnants on Dec. 10 at 10:57 a.m. EST (1557 UTC). This view (looking toward the northeast) showed …
This animation shows the distribution of rainfall from March 7 through 14, 2016 over the south central U.S. Purple indicates highest rainfall amounts. Credit: NASA/JAXA/SSAI, Hal Pierce
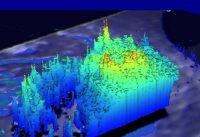
This 3-D Flyby animation shows Ophelia’s storm tops heights on Oct. 10 from GPM radar data that remain after GOES satellite data are removed. The area covered by GPM’s 151.9 …
On Oct. 18 the GPM core satellite found extremely heavy rainfall was located in the southeastern side of the typhoon’s eye wall. Powerful storms there were dropping rain at a …
On Aug. 19, GPM saw Danny’s rain structure was still asymmetric as noted by the large rain band (identified by the green arc indicating moderate rain) being located mainly on …
GPM showed thunderstorm cloud tops reaching to just over 14 km (8.6 miles) high and PM showed rainfall of up to 52.8 mm (2.0 inches) per hour. The GPM data …
On Sept. 3, GPM showed that Jimena’s eyewall (dark red semicircle indicating intense rainfall) continued to erode away on the southern side. Most of the rain bands south of the …