OVATION Prime Model and “Aurorasaurus” Auroral Observations
Published on June 27, 2017
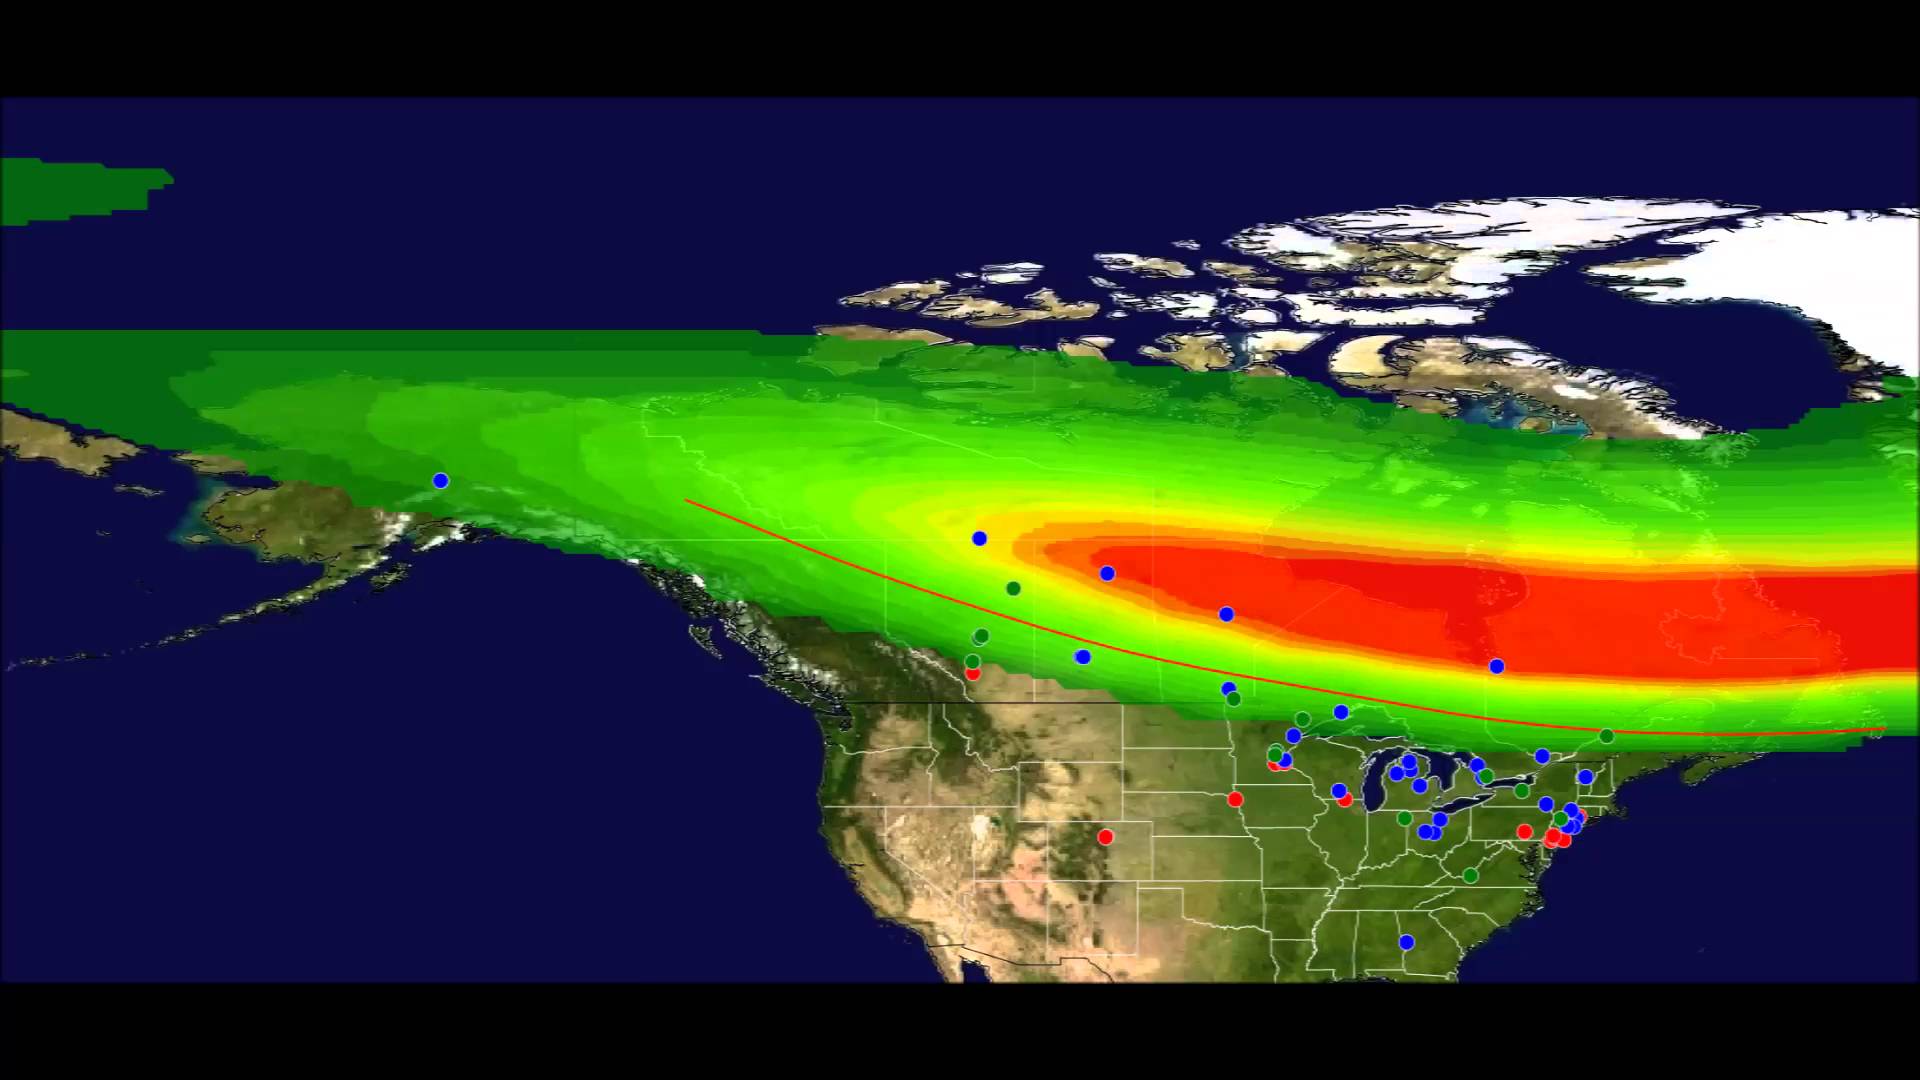
This video shows the auroral oval, as modeled using OVATION Prime (2013), along with citizen science reports collected by the Aurorasaurus project for the St. Patrick’s Day storm over March 17-19, 2015. The red swath indicates a higher probability that an aurora could be seen from that area. Yellow and green areas indicate a lower probability of visibility. Positive sightings are green dots, verified reports are blue, and negative reports are red.
Video Credit: Aurorasaurus/Nathan Case
More information:
