Published on February 14, 2017
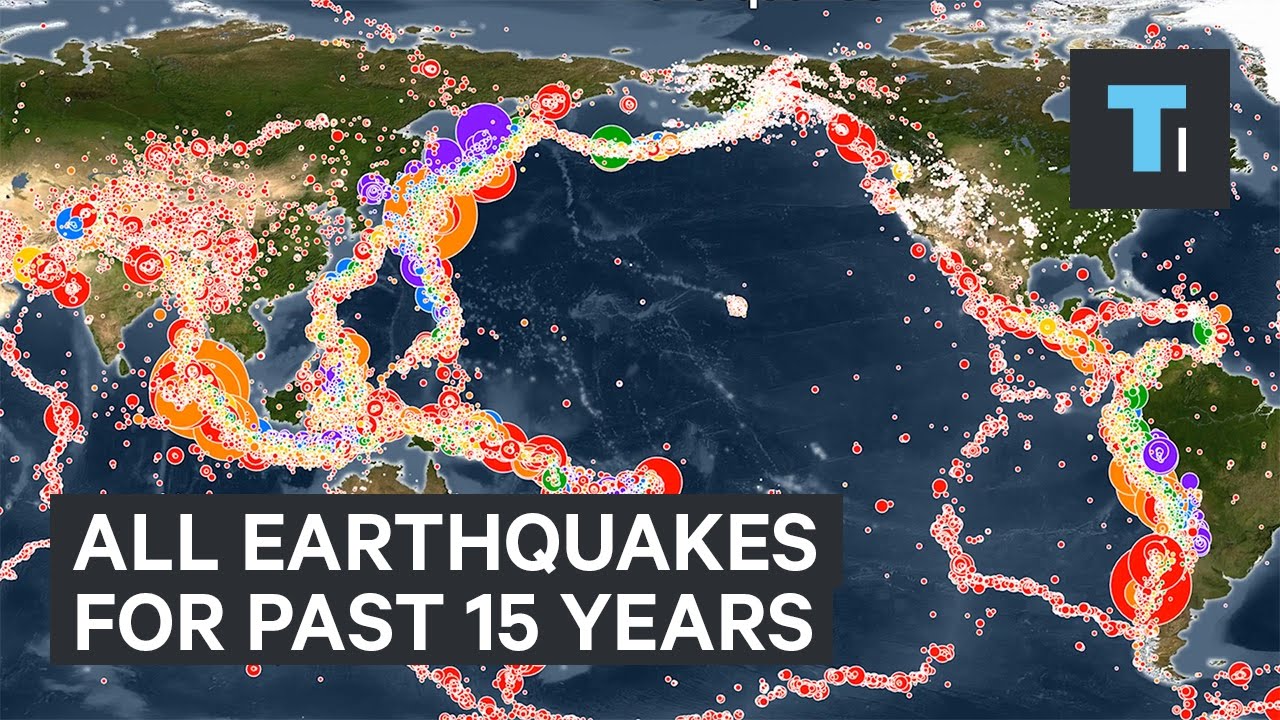
This animated map created from the NOAA, NWS, and PTWC shows every recorded earthquake in chronological order from January 1, 2001 to December 31, 2015. The size of the circle shows the magnitude of the earthquakes in relation to each other. The color represents the earthquake depth.
Read more:
FACEBOOK:
TWITTER:
INSTAGRAM:
TUMBLR:
